Fibonacci Levels
Compare the current market price against key retracement levels and quickly see how far each stage is from the live price.
Trading workflow companion
Plan staged stock entries with Fibonacci retracement levels, live market data, risk checks, and exportable strategy reports.
What it helps with
Compare the current market price against key retracement levels and quickly see how far each stage is from the live price.
Split your investment amount across selected Fibonacci stages and review estimated shares, cost, target profit, and downside checks.
Search a ticker, load recent candles, and use the latest close as the current price for a more practical plan.
Save strategy setups for later review, then export or print PDF reports for your own notes or discussions.
Across devices
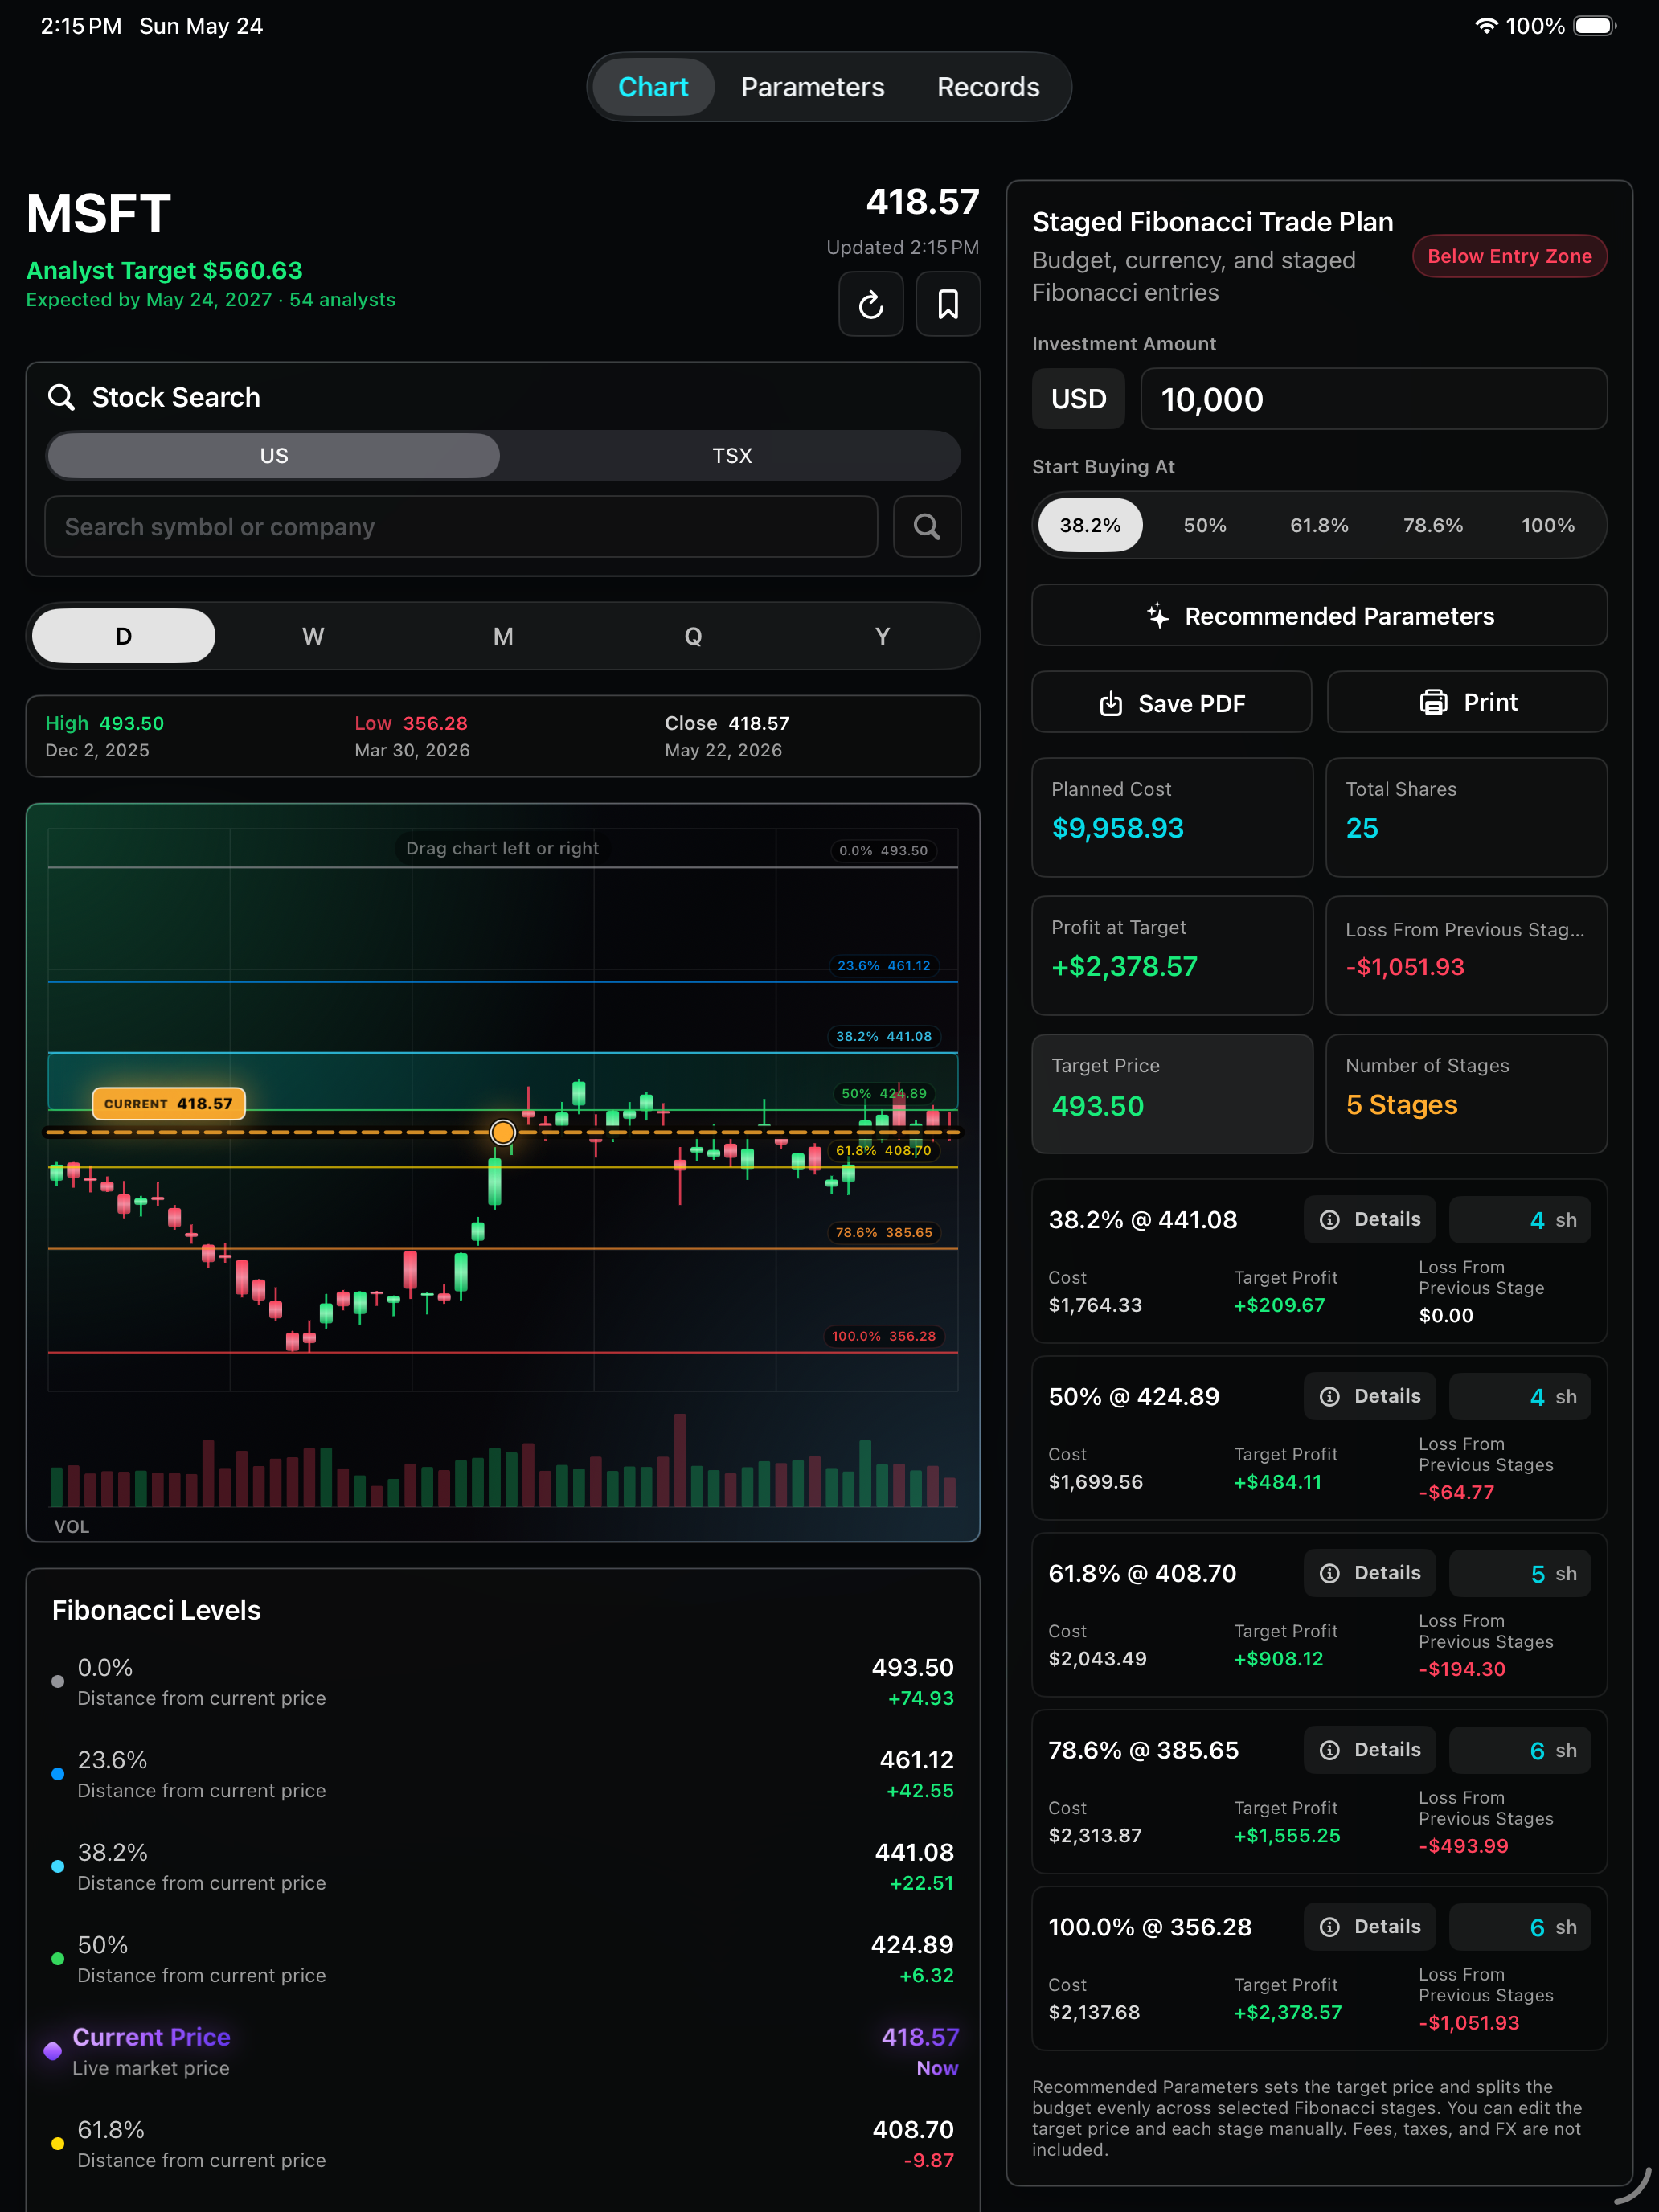
On iPad, the chart, Fibonacci Levels, and staged trade plan can be reviewed with more context on screen. This is useful when you want to compare level prices, planned shares, target profit, and risk checks without constantly scrolling.
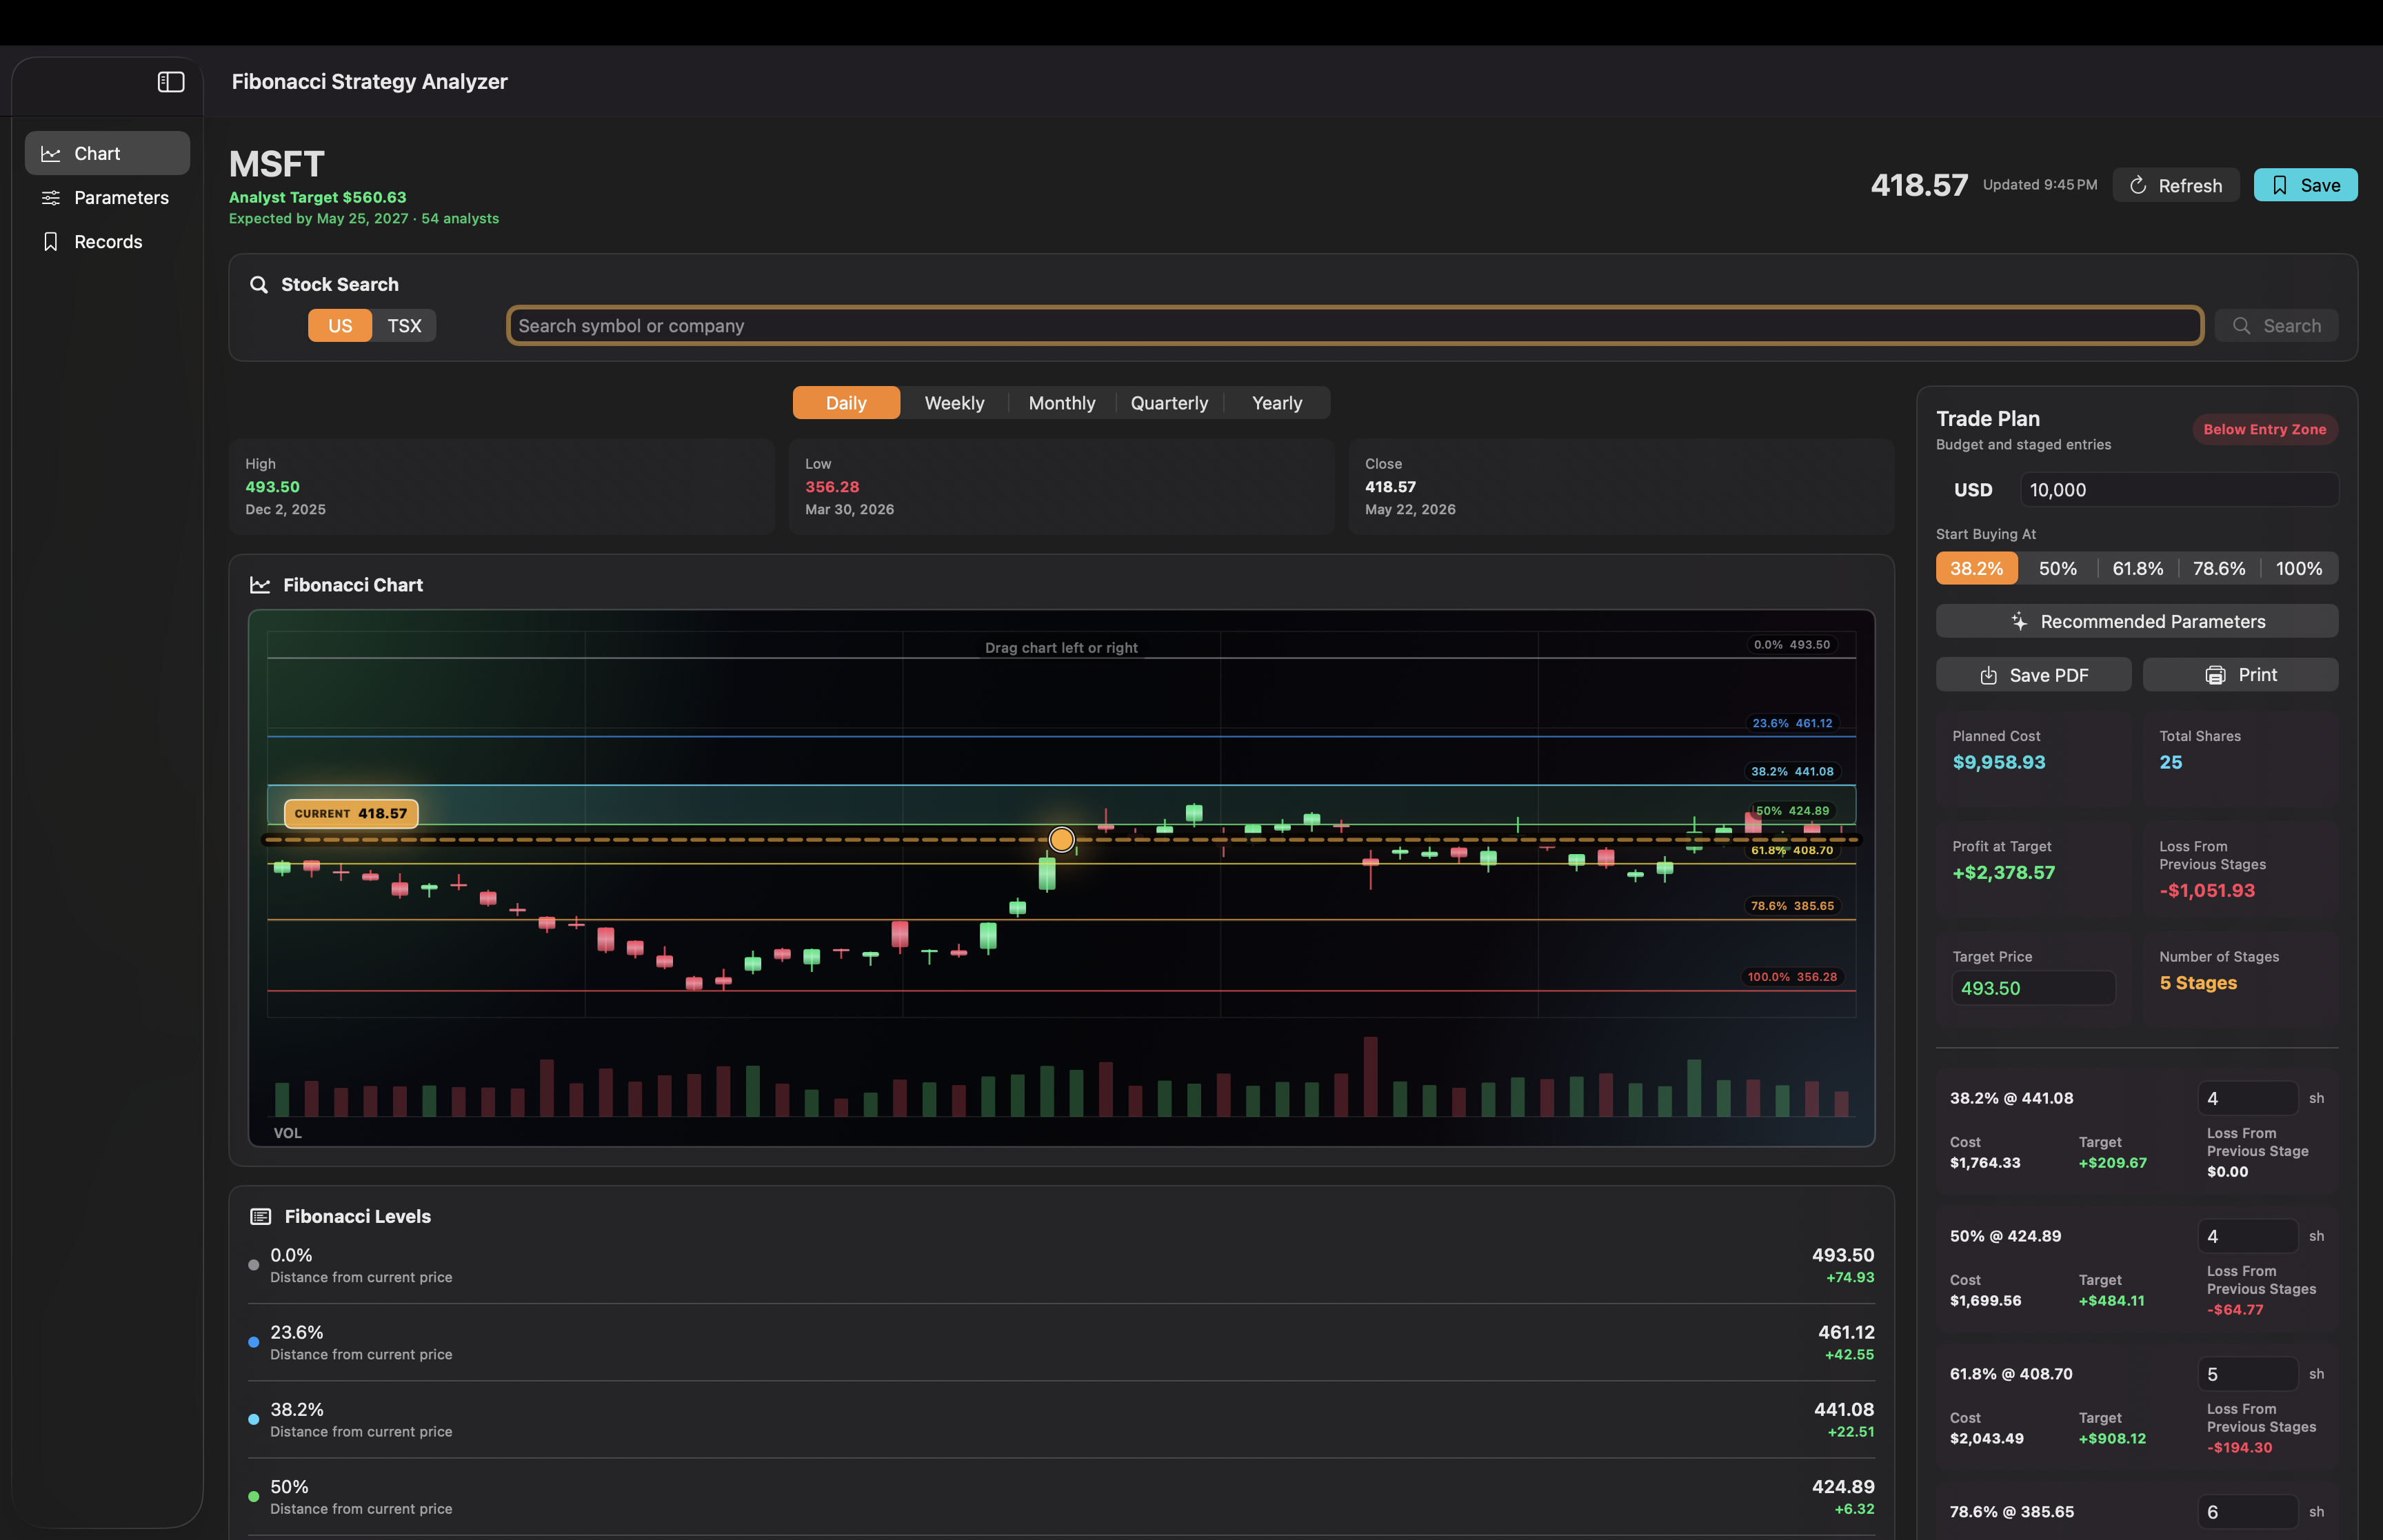
On Mac, the sidebar keeps Chart, Parameters, and Records visible while the main workspace gives the candlestick chart more horizontal space. It is better for longer review sessions, report preparation, and comparing setup details before saving.
Detailed walkthrough
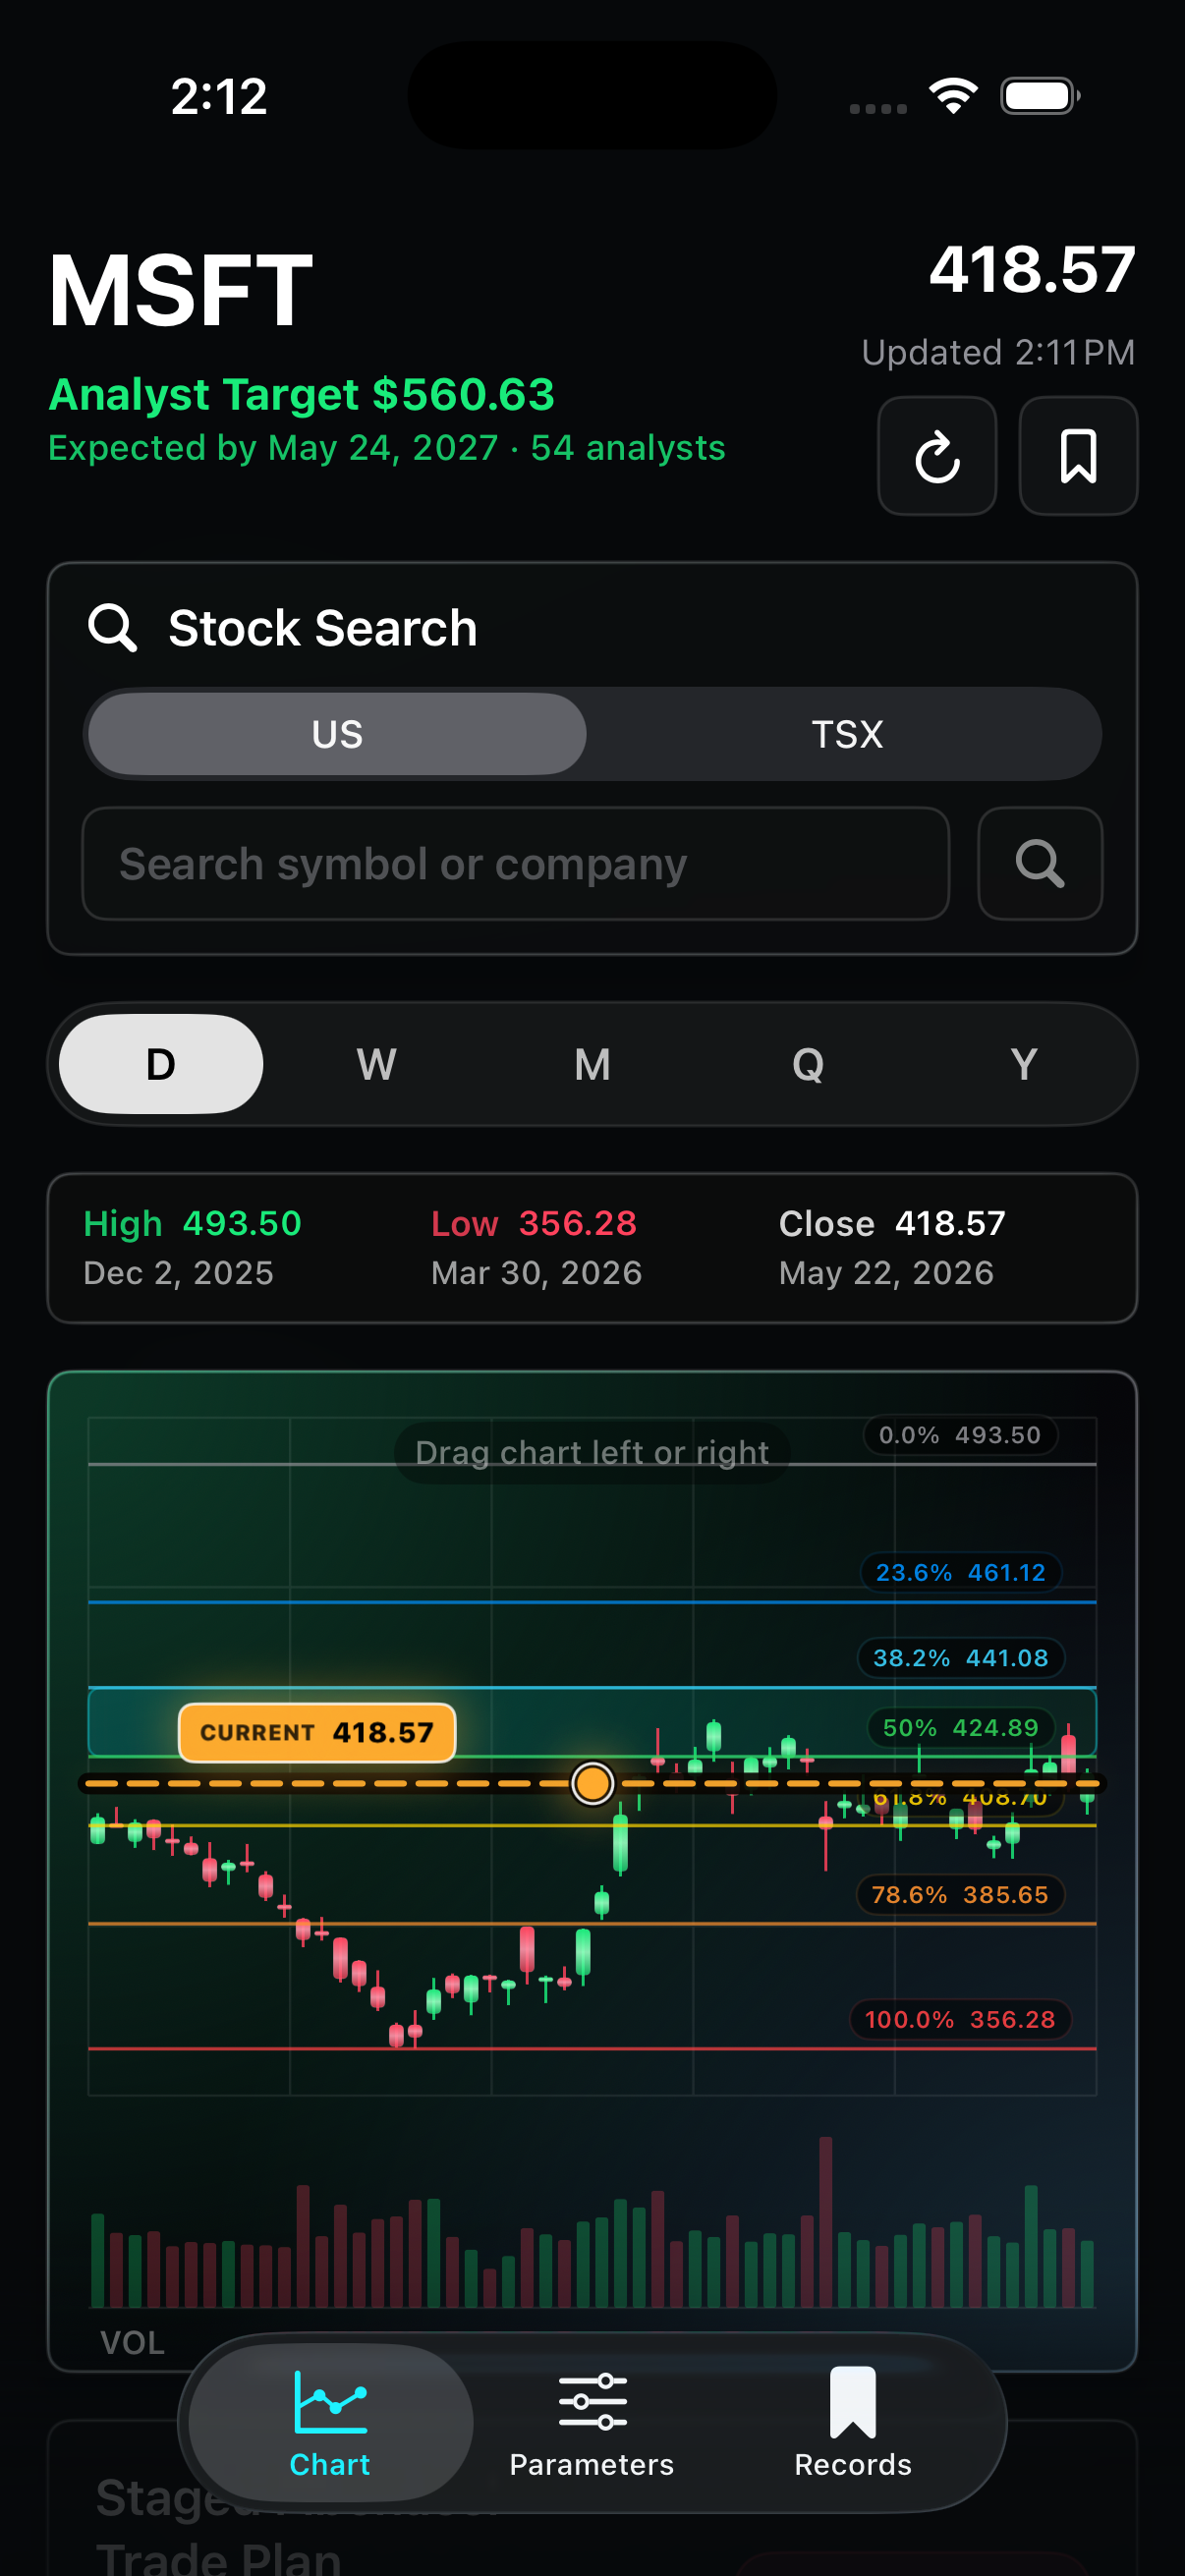
Start in the chart screen. Type a stock symbol, choose the market, and run the search. After the data loads, confirm that Current Price, Close, and the candlestick chart are populated.
Current Price = latest loaded market price or latest close
Swing High = highest candle high in the selected timeframe
Swing Low = lowest candle low in the selected timeframe
Target Price = custom target, or analyst target / recommended target when applied
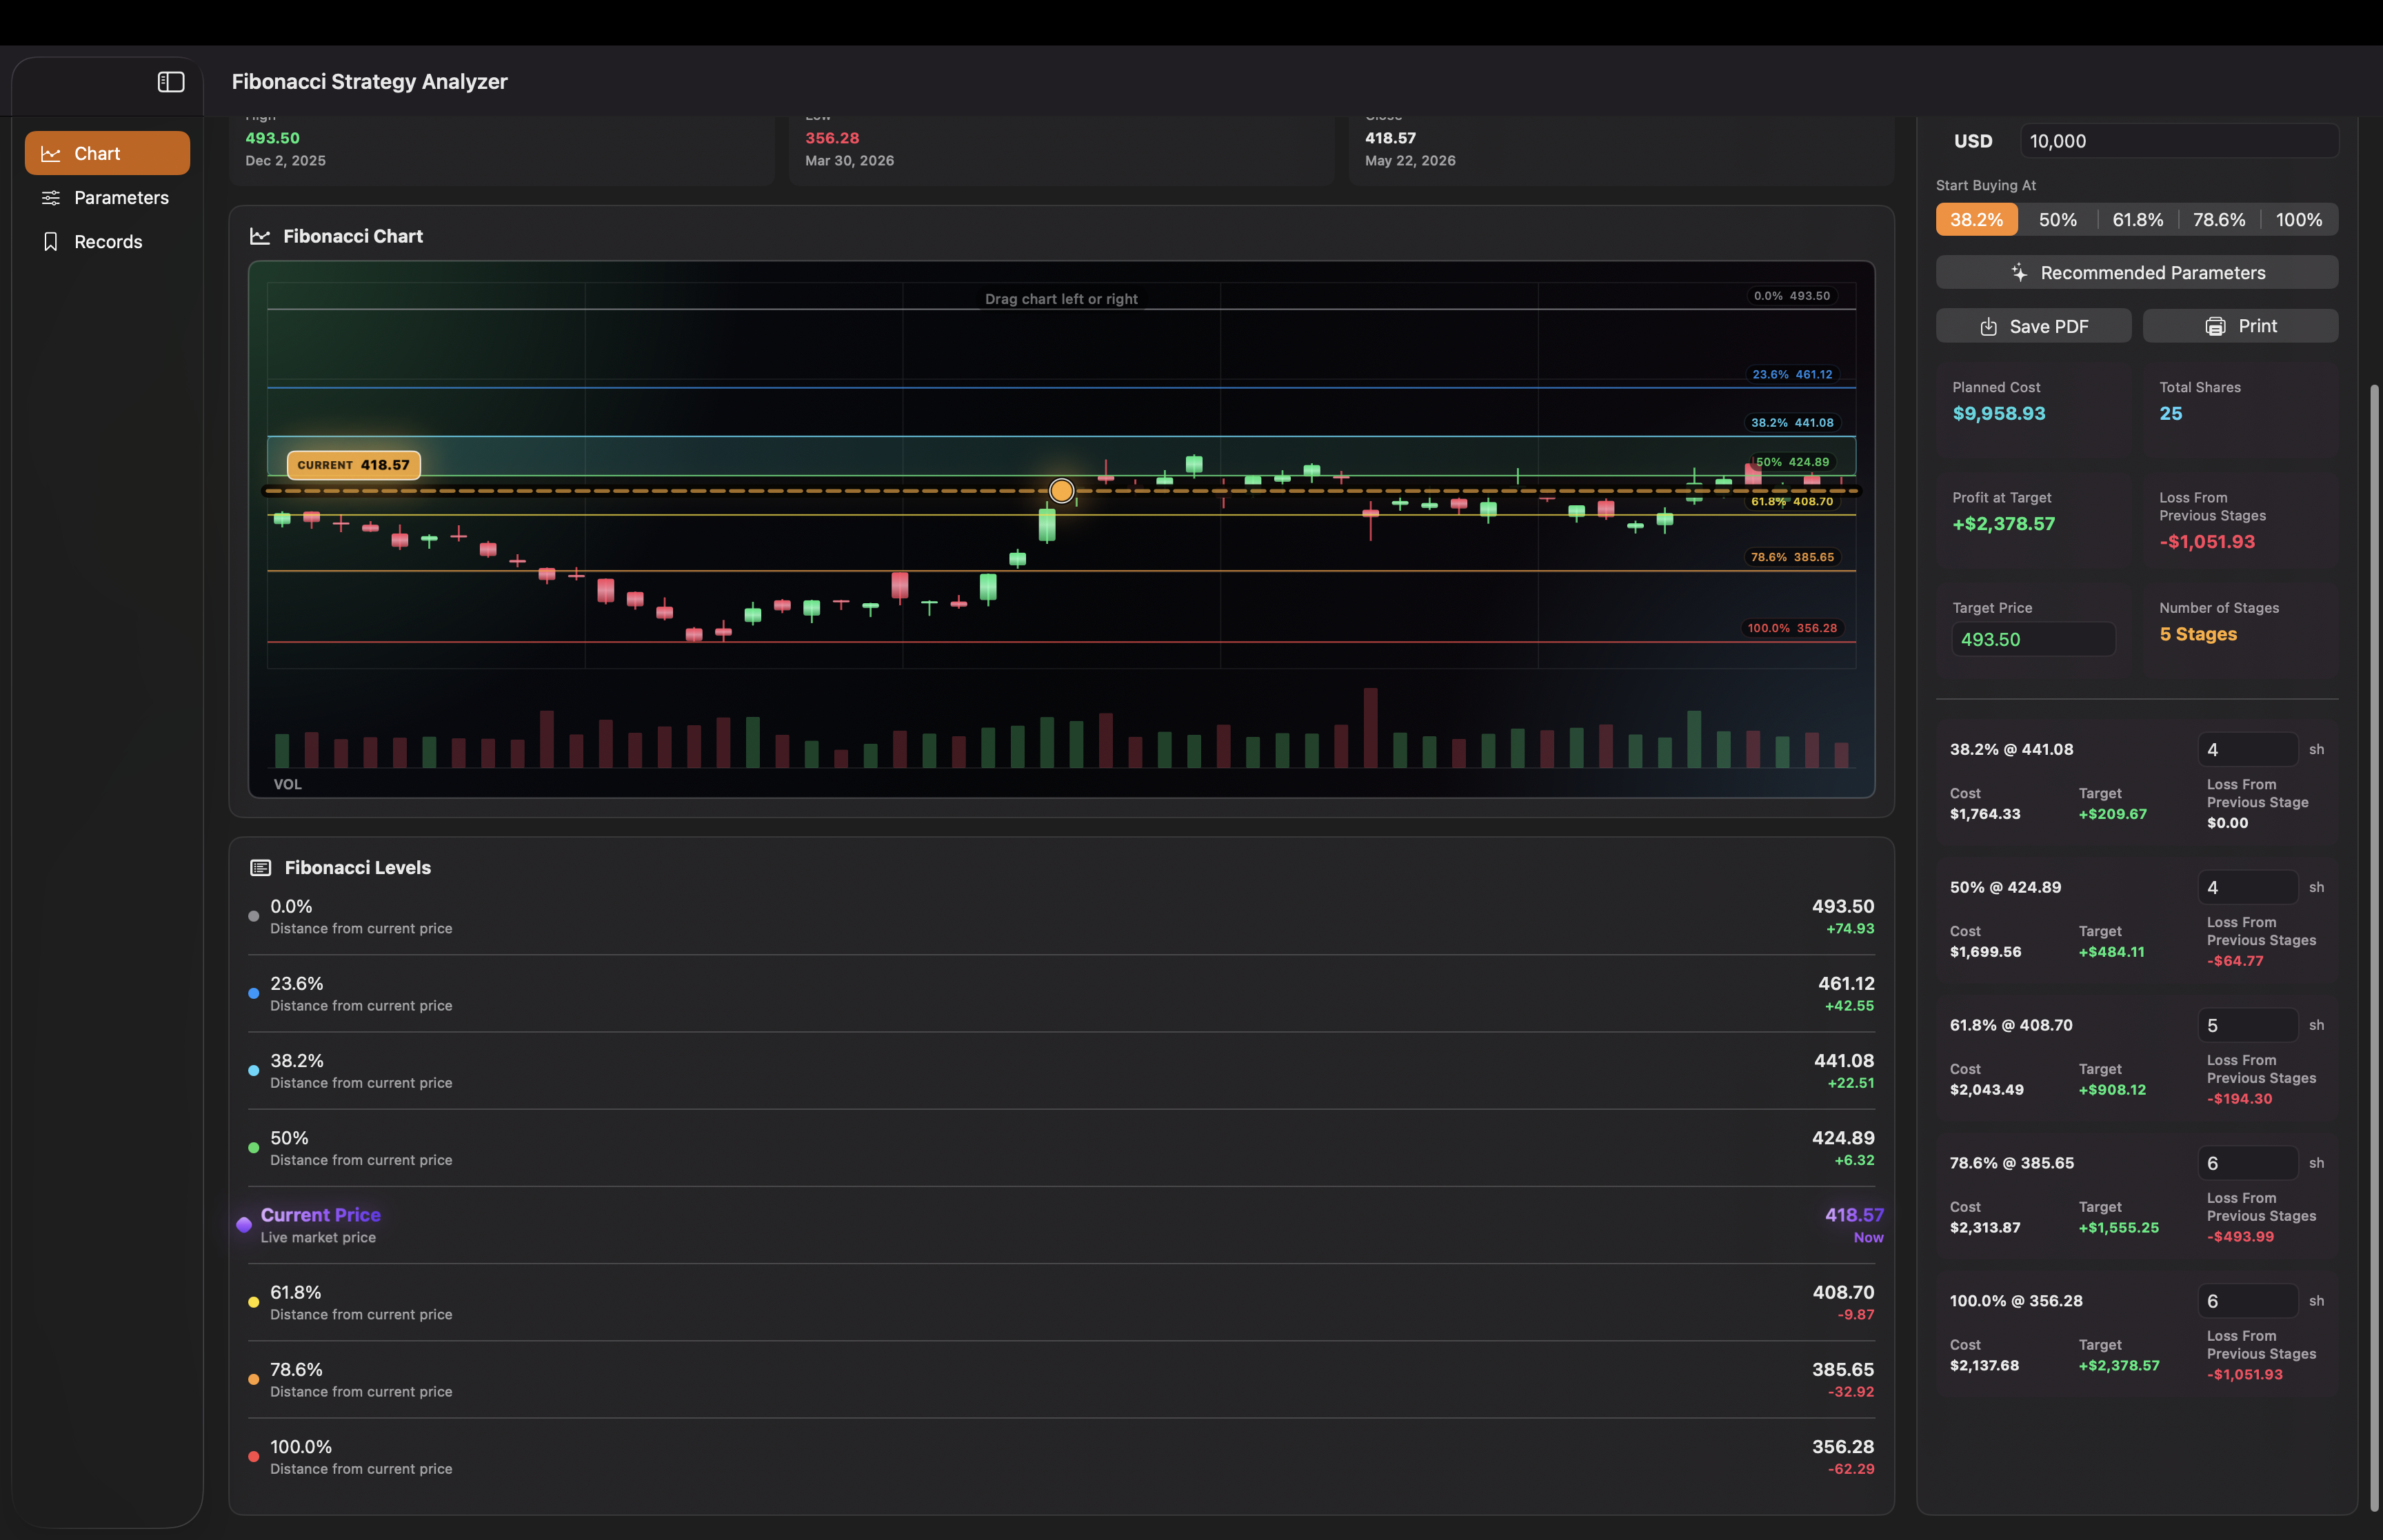
Example from the screenshots: High 493.50, Low 356.28, Current Price 418.57, Investment 10,000.
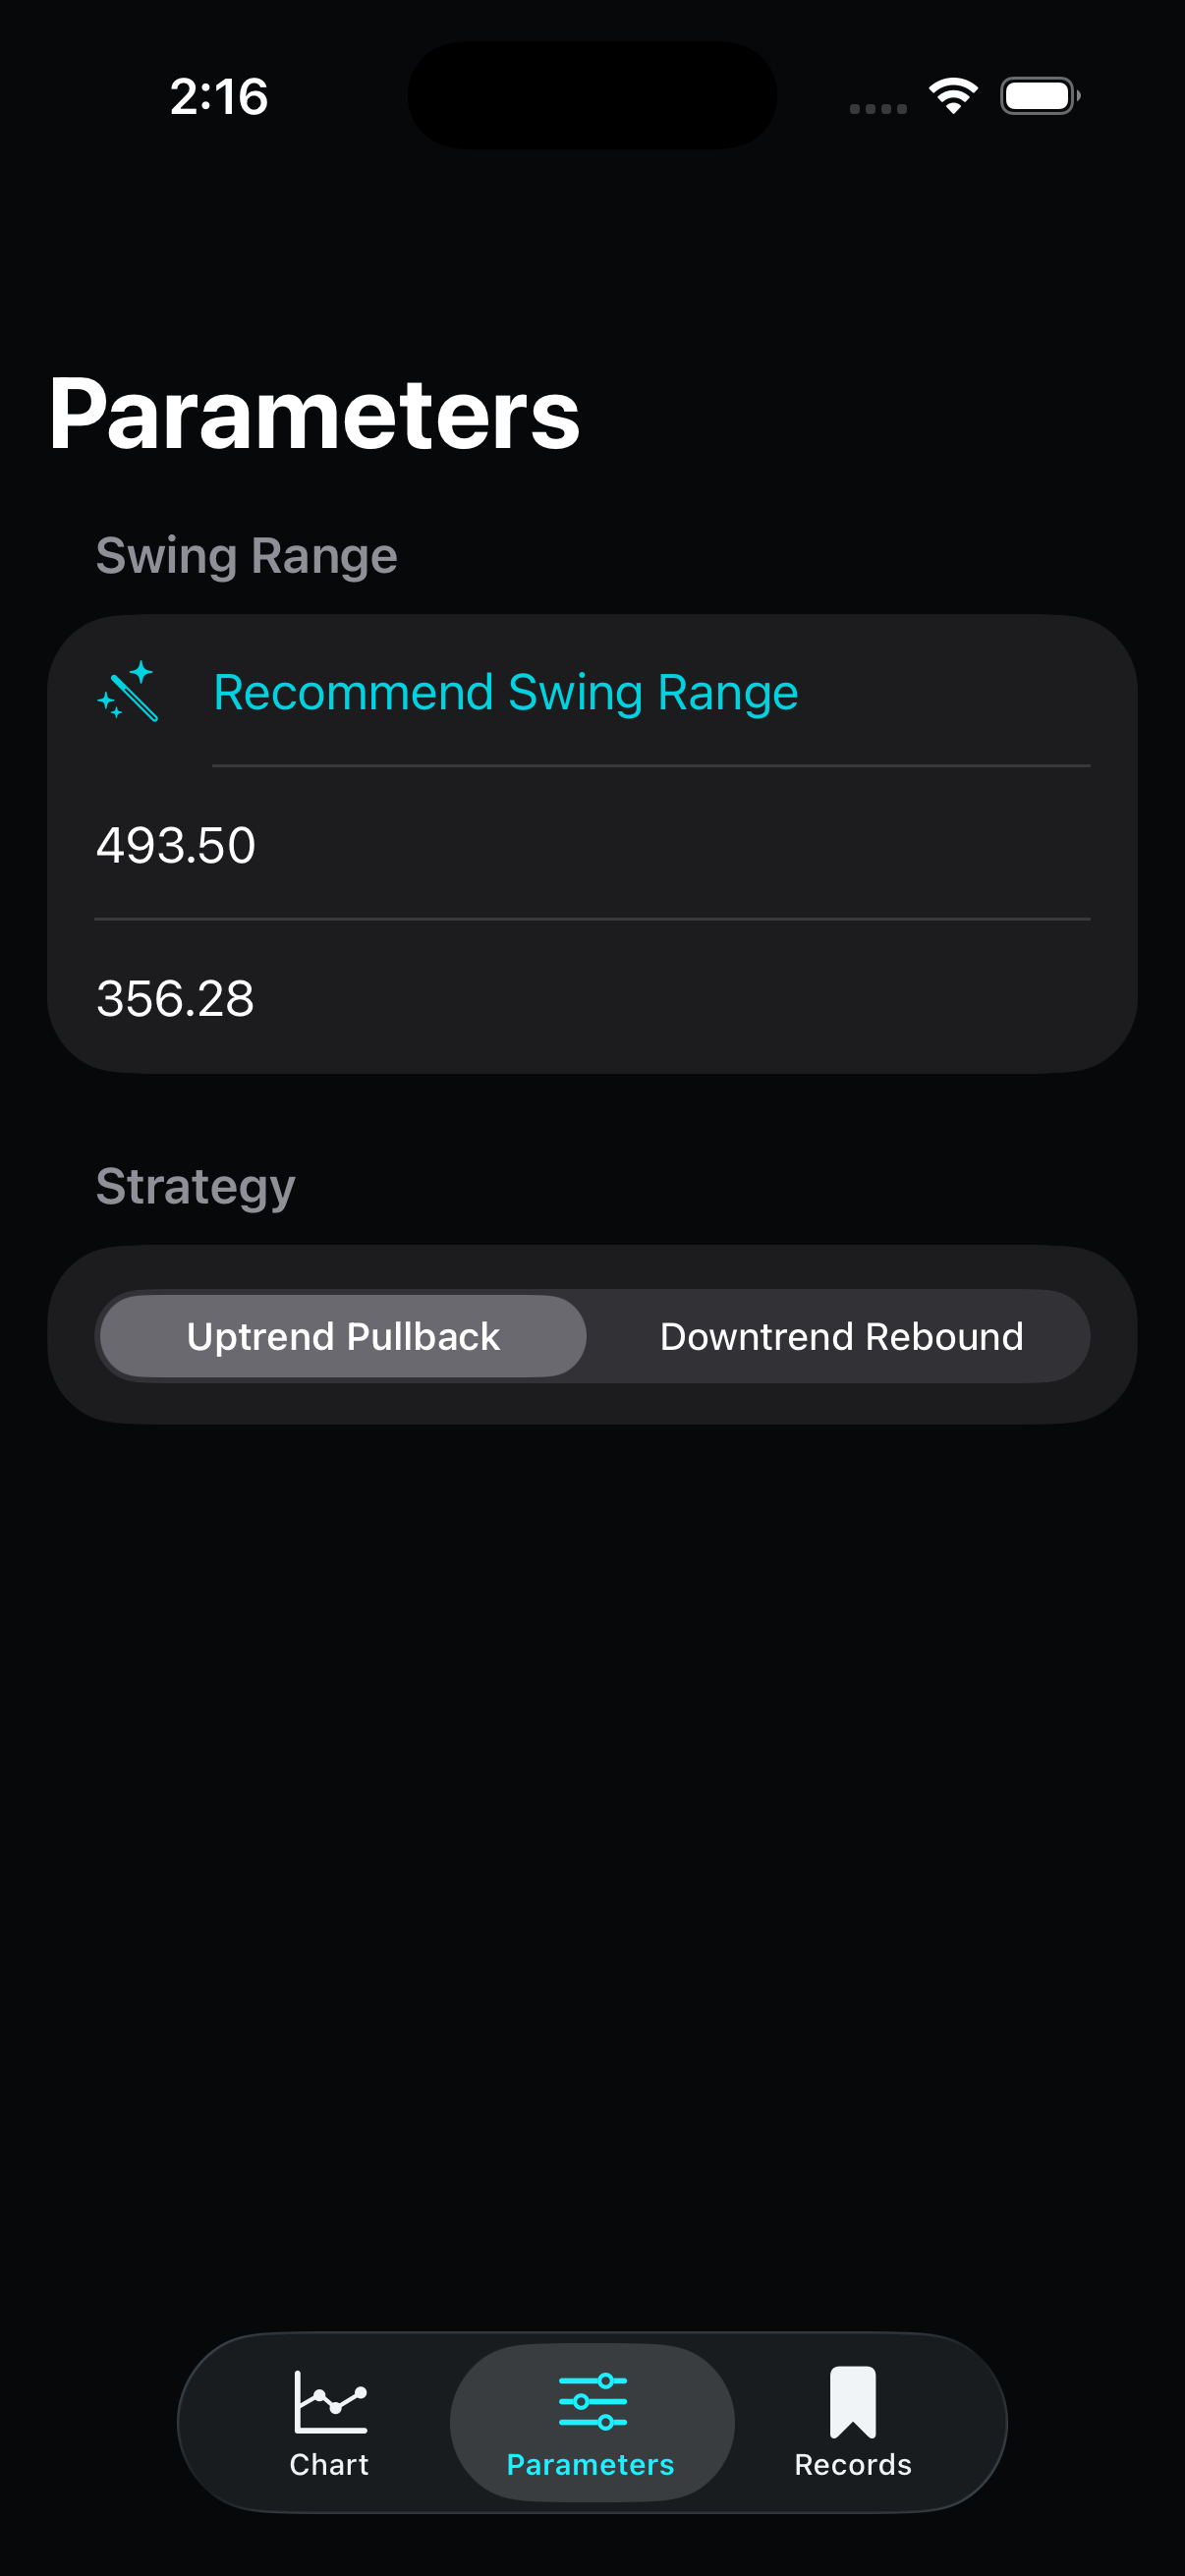
Fibonacci levels are only as useful as the price range you choose. Use a clear recent swing high and swing low from the timeframe you are analyzing.
Range = max(abs(High - Low), 0.01)
Range = max(abs(493.50 - 356.28), 0.01) = 137.22
The 0.01 minimum prevents divide-by-zero style calculations when high and low are the same.
Level Price = High - (High - Low) × Retracement%
Rebound Level Price = Low + (High - Low) × Retracement%
38.2% Pullback = 493.50 - 137.22 × 0.382 = 441.08
Pullback measures down from the swing high. Rebound measures up from the swing low.
Entry Start = selected stage, rounded to 38.2%, 50%, 61.8%, 78.6%, or 100%
Entry Zone = sorted(Level Price at Entry Start, Level Price at Next Stage)
38.2% to 50% Entry Zone = 424.89 to 441.08
Pullback Stop Loss = Low - Range × 0.03 = 356.28 - 137.22 × 0.03 = 352.16
Rebound Stop Loss = High + Range × 0.03
Pullback First Target = 23.6% level = 461.12
Pullback Second Target = High = 493.50
Rebound First Target = 23.6% level
Rebound Second Target = Low
If Entry Zone contains Current Price, Status = In Entry Zone
If Current Price > Entry Zone High, Pullback Status = Waiting for Pullback
If Current Price > Entry Zone High, Rebound Status = Near Resistance
If Current Price < Entry Zone Low, Pullback Status = Below Entry Zone
If Current Price < Entry Zone Low, Rebound Status = Waiting for Rebound
The chart shows price movement, Fibonacci bands, and the current price line. The Fibonacci Levels list gives the exact level prices and the distance from the live price.
0.0% = 493.50
23.6% = 493.50 - 137.22 × 0.236 = 461.12
38.2% = 493.50 - 137.22 × 0.382 = 441.08
50.0% = 493.50 - 137.22 × 0.500 = 424.89
61.8% = 493.50 - 137.22 × 0.618 = 408.70
78.6% = 493.50 - 137.22 × 0.786 = 385.65
100.0% = 356.28
Distance = Level Price - Current Price
38.2% Distance = 441.08 - 418.57 = +22.51
61.8% Distance = 408.70 - 418.57 = -9.87
Current Price Row = 418.57, Distance = Now
Positive distance means the level is above the current price. Negative distance means it is below.
Executed Entries = selected stages with Percent ≤ displayed level percent
Profit/Loss at Price = Σ((Displayed Price - Entry Price) × Shares) for executed entries
Example at 50% = (424.89 - 441.08) × 4 = -64.77
This is the same idea used by the Details view and the staged risk checks.
Enter the investment amount, choose the first Fibonacci level where buying should start, and review the recommended shares for each stage.
Selected Stages = levels where Percent ≥ Start Buying At and Percent > 0
For Start Buying At 38.2%, Selected Stages = 38.2%, 50%, 61.8%, 78.6%, 100%
Per-stage budget = Investment ÷ Number of selected stages
Per-stage budget = 10,000 ÷ 5 = 2,000
Initial Shares = floor(Per-stage budget ÷ Stage Price)
38.2% Initial Shares = floor(2,000 ÷ 441.08) = 4
100% Initial Shares = floor(2,000 ÷ 356.28) = 5
Initial Spent = Σ(Initial Shares × Stage Price) = 8,808.31
Remaining Cash = Investment - Initial Spent = 1,191.69
Extra Shares = buy one more share at the cheapest selected stages while Remaining Cash ≥ Stage Price
The live trade plan can assign remaining cash to cheaper stages; saved records show the stored share counts.
Stage Cost = Shares × Stage Price
38.2% Cost = 4 × 441.08 = 1,764.33
Planned Cost = Σ Stage Cost
Total Shares = Σ Stage Shares
Unused Cash = Investment - Planned Cost
Triggered Entries at a stage = all selected entries up to that stage
Target Profit at Stage = Σ((Target Price - Entry Price) × Shares) for triggered entries
38.2% Target Profit = (493.50 - 441.08) × 4 = +209.67
Loss From Previous Stages = Σ((Current Stage Price - Earlier Entry Price) × Earlier Shares)
50% Loss Check = (424.89 - 441.08) × 4 = -64.77
Total Target Profit = last stage Target Profit
Total Risk Check = last stage Loss From Previous Stages
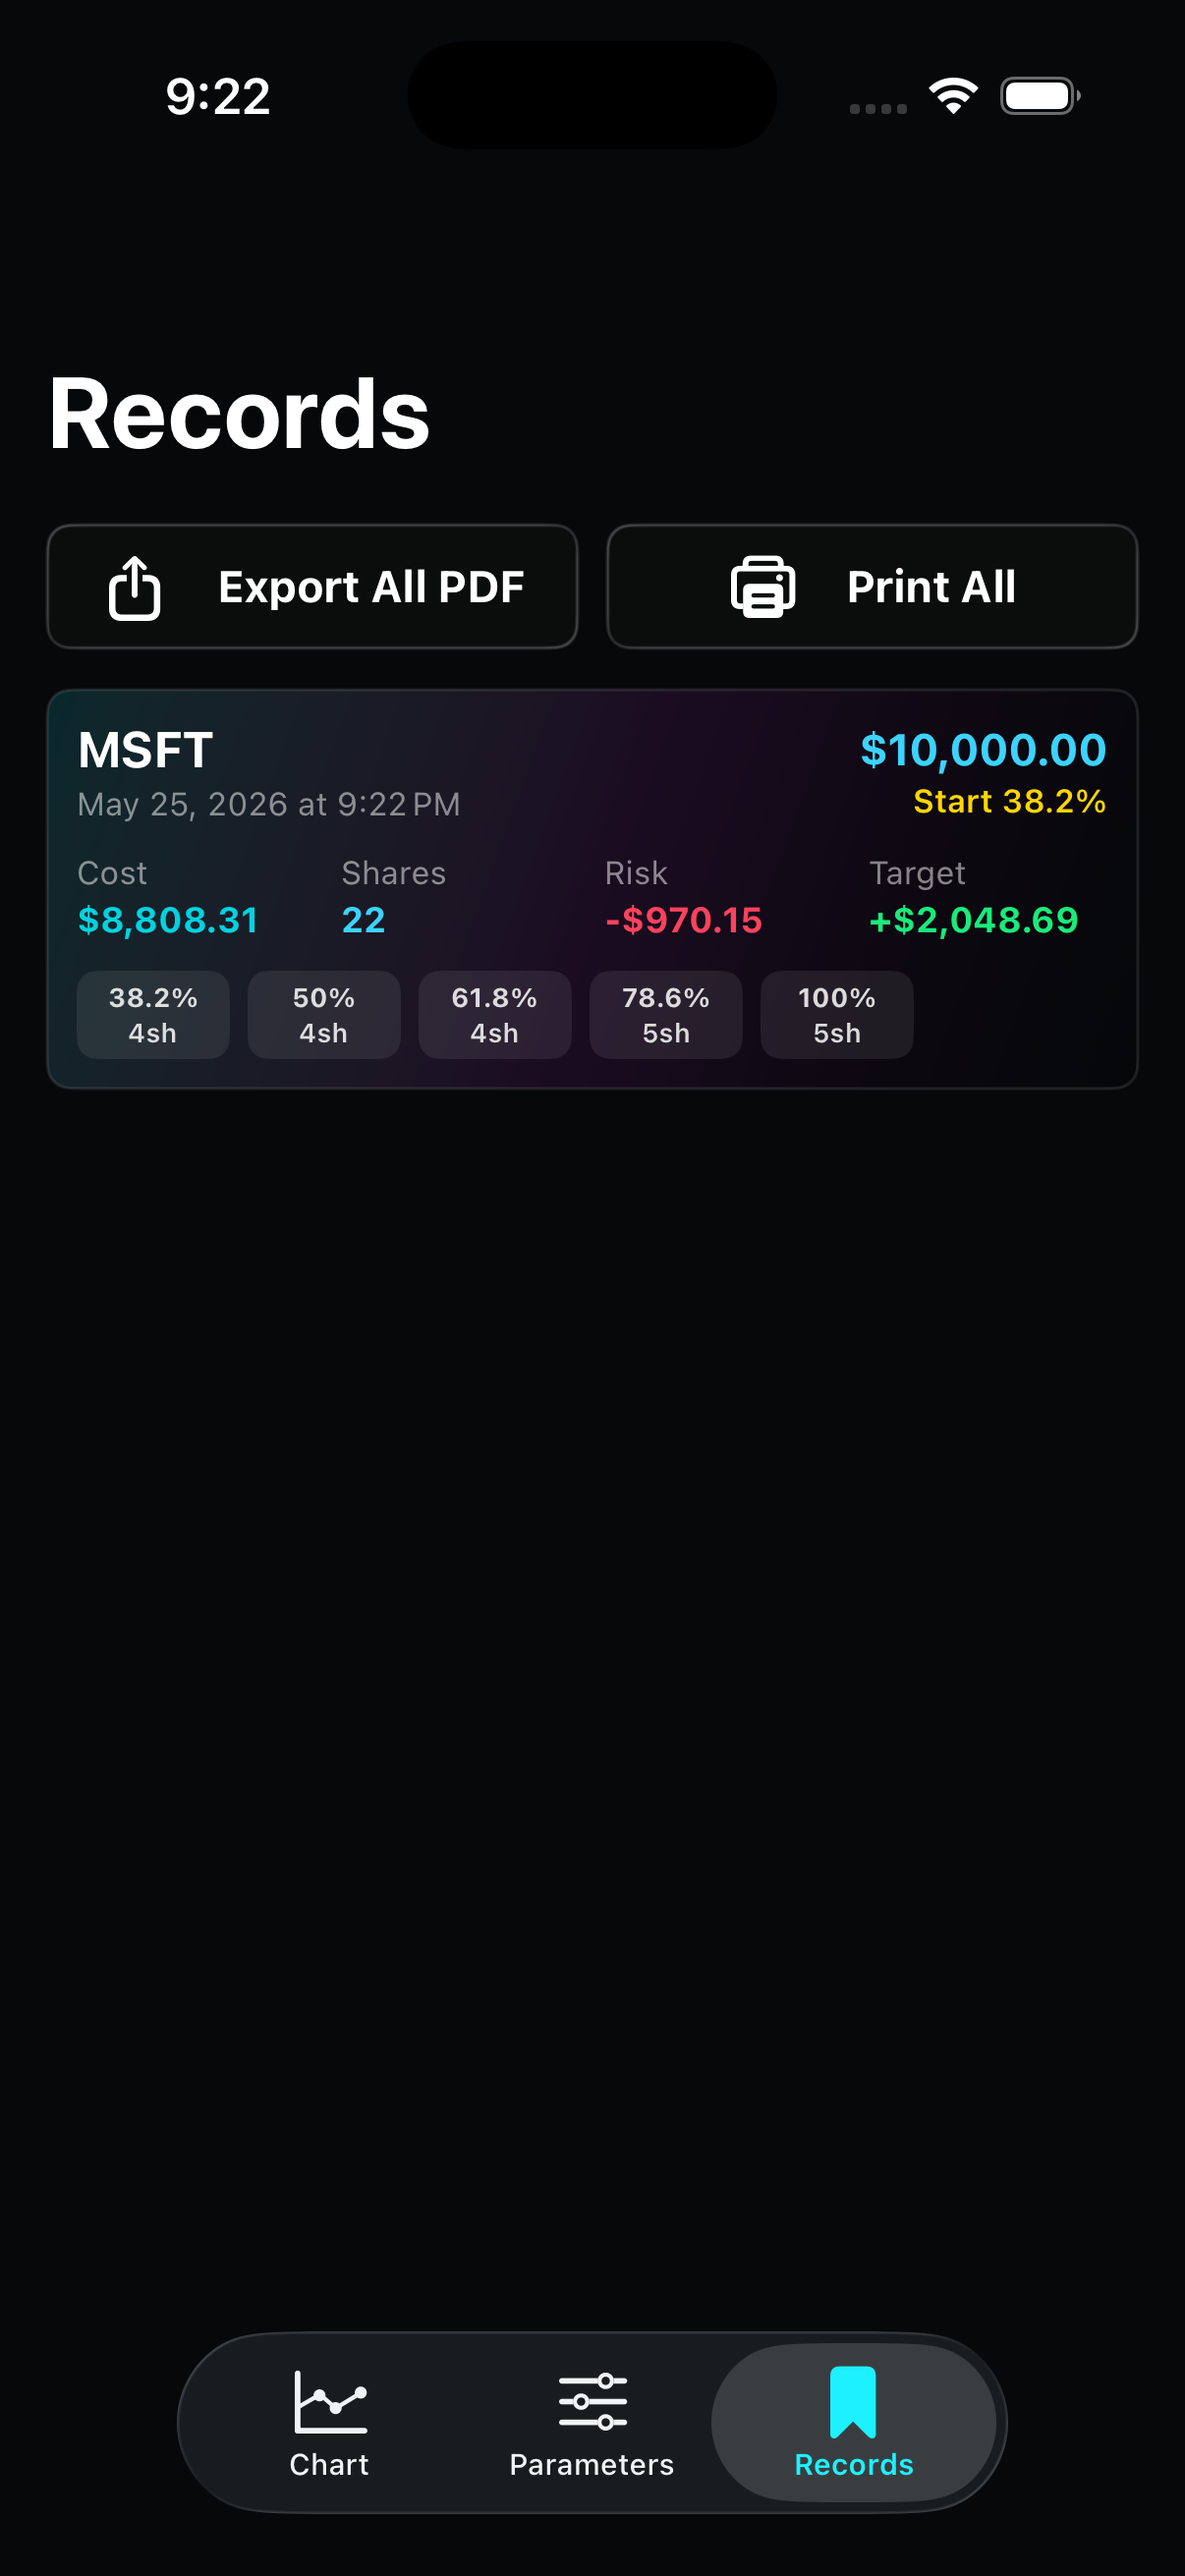
When the plan looks right, save it to Records. You can revisit saved setups later, compare them, or export a PDF report for your notes.
Saved Investment = Investment Amount at save time
Saved Planned Cost = Σ(Saved Stage Shares × Stage Price)
Saved Target = last saved stage Target Profit
Saved Risk = last saved stage Loss From Previous Stages
PDF Report Total Row = Planned Cost, Target Profit, and Risk from the saved stages
Reports use the saved snapshot so the exported numbers match what was saved, even if market data changes later.
Contact info
Send an email for support, feedback, or questions about using Fibonacci Strategy Analyzer.